Register
 Login
Login Register




April Market Calendar: Five Forces That Define Q2

Hebe Chen >
Senior Market Analyst
Hebe Chen >
Senior Market Analyst
 Updated Tue, 2026 April 7 09:27

April is the month markets stop guessing and start reckoning.
After a turbulent March, investors are confronting a hard question: is the recent market bounce a genuine inflection point, or a dead cat bounce in a darkening room? The answer will arrive in waves this month — through inflation prints, GDP scorecards, and the Fed’s increasingly fraught communications.
Here are the five themes that will define April.
- Geopolitics: The Market’s New Centre of Gravity
What began on February 28 as US-Israeli strikes on Iran’s leadership and nuclear infrastructure has become the single most important market variable of 2026. As April opens, the conflict is entering what Washington is quietly signalling may be its final phase.
The two-to-three week window is now the market’s primary countdown. An orderly conclusion sees the war premium fade, Brent retreat, and rate-cut optionality return. But stalemate or escalation — still live possibilities as the new month begins — will continue to poison every asset class in its path.
2. Is the Rebound Real? S&P 500 Technical Read
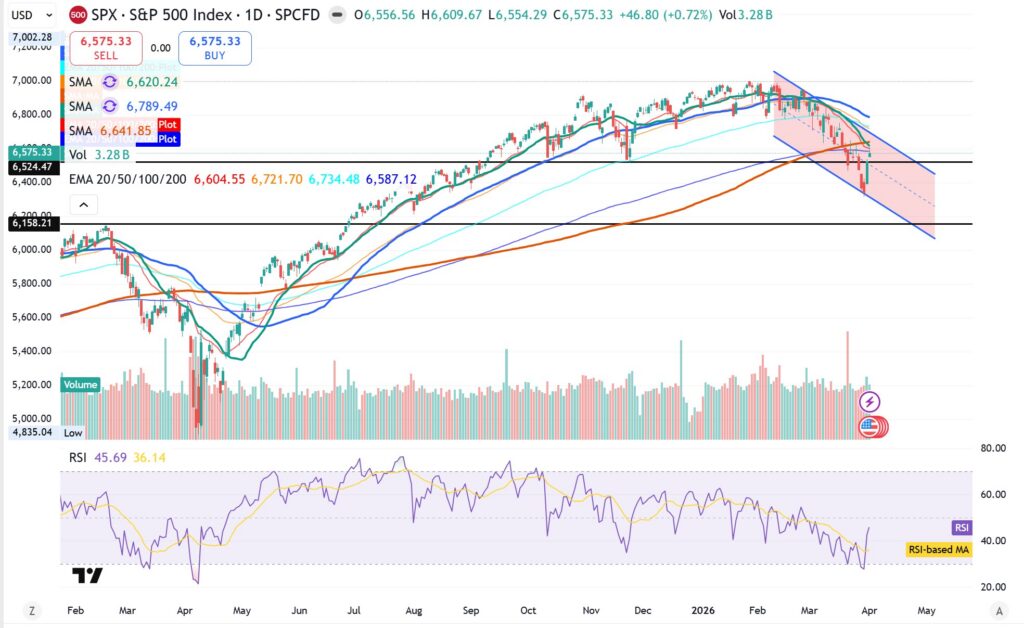
The S&P 500 has shown signs of life following a bruising March, but from a trend-trading perspective, the index is not out of the woods. A confirmed reversal requires three distinct signals — and as of early April, none have fully triggered:
▸ Bottom Construction: A structural floor is beginning to form — but beginning is not the same as established.
▸ Price Breakout: The index must decisively climb and hold above key moving averages. A one-day surge doesn’t count.
▸ The Pivot: Moving averages must transition from a downward slope to an upward trajectory. This has not happened yet.
Until these three signals align, the direction of least resistance remains down. Without a structural pivot in the averages, every rally risks being absorbed by the prevailing trend.
3. Inflation Pulse: The Energy Overhang
Inflation data is the centrepiece of the April calendar — but it must be read through the lens of energy costs. The recent surge in oil prices is now baked into the upcoming prints for major economies. Here is what each print tells us:
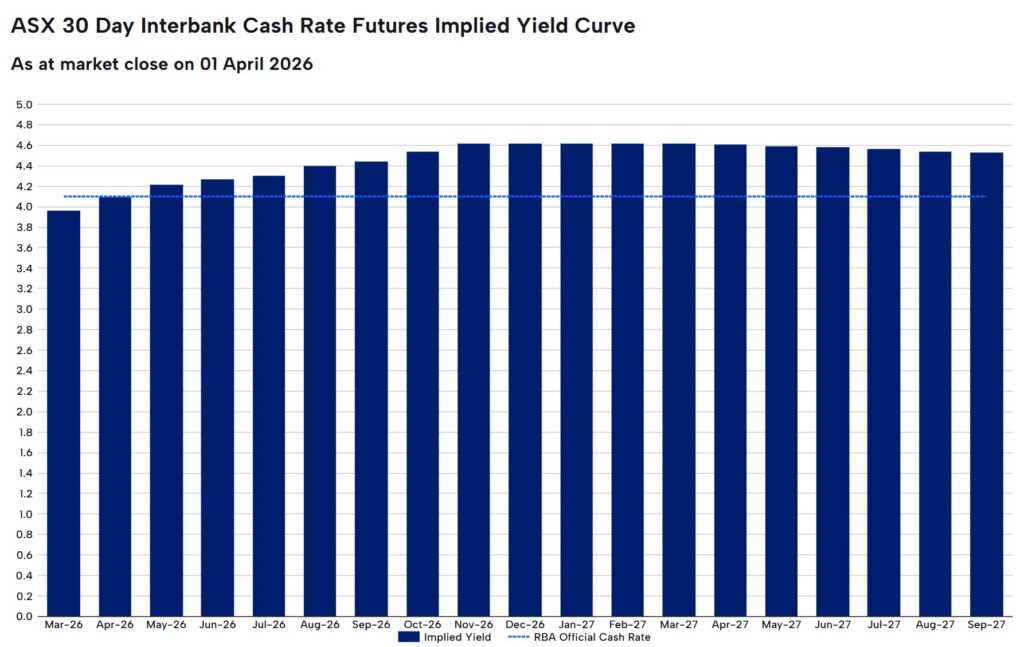
▸ Australia (April 20 — MUST-WATCH): The Quarterly Inflation Rate is the key event for ASX and AUD. As the ASX 30-Day Interbank Cash Rate Futures curve show, market has priced in 50bps hikes before the year-end. A sticky quarterly inflation print on April 20 would cement that repricing and put a third consecutive RBA hike firmly on the table.
▸ United States (April 10): Markets are bracing for CPI and Core PCE to reflect higher logistics costs and the long-tail effects of regional conflict on goods prices.
▸ China (April 10): As the world’s largest energy importer, China’s inflation print will reveal how much input cost pressure is being absorbed — or passed through — to the industrial sector. A higher-than-expected print complicates the PBOC’s already narrow path toward monetary easing, with downstream consequences for commodity exporters including Australia.
4. The Fed’s Final Word — and Pivotal Signal
The April 30 interest rate decision is, in itself, a non-event. No change is expected, and none should be. What matters is the statement — specifically, whether the Fed signals any shift in its tolerance for persistent inflation pressure.
The more consequential story is the leadership transition. Jerome Powell’s tenure ends in May, and markets are actively reading Fed communications for clues about how the baton is passed — and whether the incoming leadership will maintain policy continuity or signal a more aggressive pivot. Any deviation from the established path will be interpreted as a precursor to regime change. Uncertainty about whether Powell remains on the Board of Governors compounds the risk further.
5. Q1 GDP: The Global Scorecard
April delivers the first full reckoning of 2026. GDP growth rates for the US, EU, and China all land in the final week of the month. Early indicators point to a fragmented picture:
▸ United States: Fiscal support is doing the heavy lifting. Strip it out and the underlying growth picture is considerably less compelling — which matters enormously for the Fed’s forward guidance.
▸ European Union: Export dampening from geopolitical uncertainty and trade tariff spillover is weighing on the bloc. Expect a soft print, with the ECB April 30 decision likely to reflect that softness.
▸ China: The Q1 GDP print (April 16) arrives alongside the inflation data. A simultaneous miss on both growth and inflation would mark the beginning of a more challenging policy environment for Beijing — and a meaningful signal for Australian commodity exporters.
The ASX is directly exposed to all three of these readings. A synchronised global miss — US fiscal dependency + EU softness + China slowdown — is the scenario that reprices iron ore, LNG, and Australian banks simultaneously.
Summary:
April is a month of “re-pricing”. Q1 data, energy-driven inflation, Fed succession, and the first full read on global growth momentum will all arrive within weeks of each other. Markets have been repricing in slow motion — April accelerates that process.
The scenario to fear is not a single bad data point. It’s the convergence of several: a sticky inflation print that kills rate-cut hopes, a GDP miss that undermines the soft-landing narrative, and a Fed statement that reads as unsettled. That combination doesn’t produce volatility — it produces a re-rating.
April Major Economic Calendar:
April 3rd
US: Non-Farm Payrolls & Unemployment Rate
April 9th
US: Core PCE Price Index
April 10th
CN: Inflation Rate
US: Inflation Rate
April 16th
AU: Unemployment Rate
CN: GDP Growth Rate Q1
April 20th
AU: Quarterly Inflation Rate
April 28th
JP: BoJ Interest Rate Decision
April 30th
US: Fed Interest Rate Decision
EU: GDP Growth Rate Q1
US: GDP Growth Rate Q1
EU: ECB Interest Rate Decision
Disclaimer: The material provided here has not been prepared in accordance with legal requirements designed to promote the independence of investment research and as such is considered to be a marketing communication. Whilst it is not subject to any prohibition on dealing ahead of the dissemination of investment research we will not seek to take any advantage before providing it to our client. No representation or warranty is given as to the accuracy or completeness of this information and therefore it shouldn’t be relied upon as such. Any research provided does not have regard to specific financial situations, needs or investment objectives. Vantage accepts no responsibility for any use that may be made of these comments and for any consequences that result. Consequently, any person acting on it does so entirely at their own risk. We advise any readers of this material to seek professional advice where necessary. Without the approval of Vantage, reproduction or redistribution of this information isn’t permitted.
-

Open Trading Account
Discover the endless trading possibilities with our cutting-edge platform, designed to empower our traders. Practice trading the markets with a free demo account today.
-

Download Vantage App
Trade on the go with the Vantage All-In-One Trading App, where smooth execution and market access come together in the palm of your hand.
-

Start Trading
Are you an existing user? Login to your account to start trading 1,000+ CFD products including forex, indices, gold, shares and more.